
This was a part of a 5 day workshop on geoMapping with Arun Ganesh(@planemad). It started with Introduction to maps and how do you go about making a map. I will talk about this in another post, combining my learning’s from the workshop and other resources that I have been looking at. This is all about “How do you make a schematic map”, the process and my experience with this exercise.
1. Pick a location
Decide a location for which you want to make a map about. It could be a country,state,city or any locality. I chose Uttarakhand, A state in north India because I spent maximum time of my childhood in this beautiful state. You could chose any place but it helps if you have a little knowledge about the place.
2.Select a theme
In this step we decide what do you want to show on the map, i.e what is the map about? I chose to show tourist places of Uttarakhand as it has a lot of hill stations and other tourist spots. While doing this you also might want to ask yourself these questions Who wants your map?, Where will it be seen? and What is its purpose?

Simple map
3.Collect Data
In this step one collects all possible data about the location that you chose, which is relevant to your theme. Again, it depends what you want to show through the map so answering previously mentioned questions helps. I collected maps about the tourist places, railmap and roadmap in Uttarakhand.


4.Classify/group features and trace
Next step is to take these maps into Illustrator or any tool you prefer, overlay these maps on top of each other like layers. It looks pretty messed up but here is the place the classification and grouping of features helps. Trace the map features according to the classifications made by you. I started with tracing of state and district boundaries. Try to make it as simple as possible.

Layered maps

State and District boundaries
5. Pick a Grid
Here we pick a grid on which we follow as a language in the entire process. It makes things look less cluttered and neat. Some of us were using 45 & 90 degree grid, to simplify the shapes. It took me time to understand that schematic map is not the exact or accurate representation of maps, hence you can see the messed up geometry in the start. This is what it was looking like at this point.

Main highways and roads
6. Simplify the geometry
The next few steps you just want to spend in simplifying the geometry more and more. Once you add more data layers it will become more complex and so it needs to be simplifies as much as possible. The next few steps show how I did that. And, I got the geometry simplified too! 🙂 Add icons, typography and the legend.


7.Upload it somewhere to share
We all, as a part of this workshop uploaded our maps to wikipedia. Link your map to an article on wikipedia and upload it there. I uploaded my map on the article about Uttarakhand in the Tourism section and Tourist places in Uttarakhand.
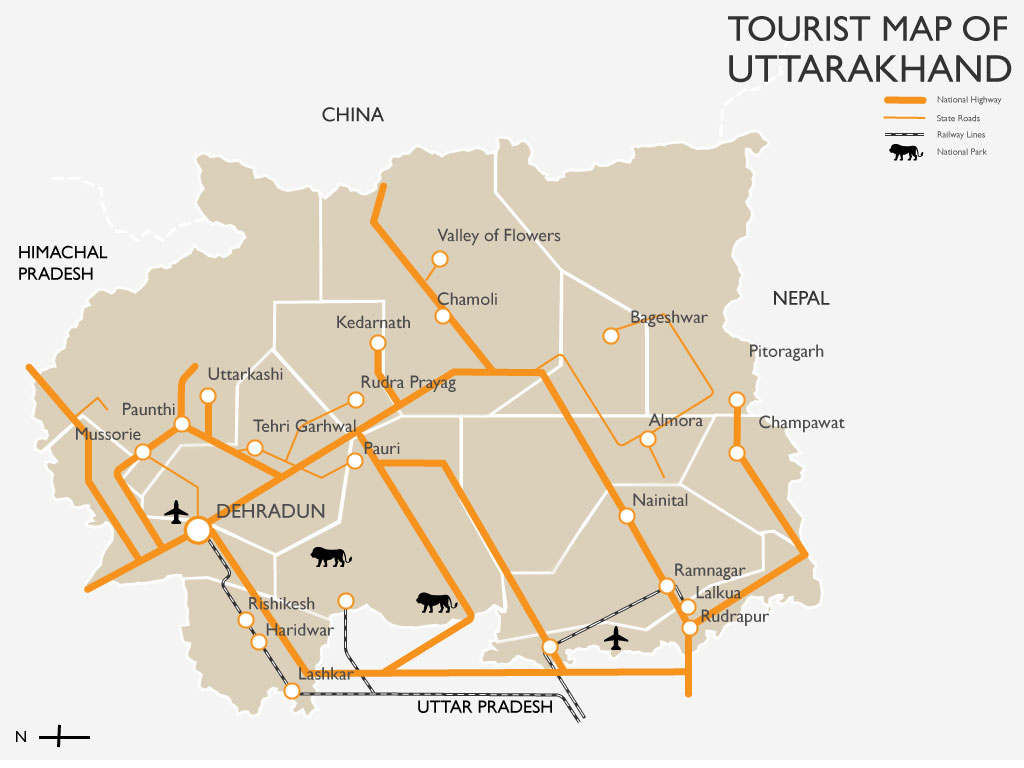
Final – Tourist map of Uttarakhand
This is what it finally looks like. Feel free to share.
